Why do baby boomers seem to have so much more money than younger generations?
The short answer is that boomers are older, and many benefited from rising home and stock values and earlier access to traditional pensions. That does not mean they simply made better choices or that every boomer is financially secure.
Here is what federal data reveal about the wealth gap, the advantages that helped create it, and the important details hidden by the headline numbers.
What Do the Headline Wealth Numbers Measure?
The Federal Reserve’s Distributional Financial Accounts provide quarterly estimates of U.S. household wealth. The data include the level and share of aggregate household wealth held by different generations.
The Fed defines baby boomers as people born from 1946 through 1964.
Aggregate wealth describes everything held by an entire generation. It should not be read as the wealth of a typical household or as an equal division of the total. A generation’s size and the fortunes of its wealthiest members can strongly affect its overall share.

Does Age Explain Much of the Difference?
Age matters because a snapshot of older and younger households is not a like-for-like comparison. As the Federal Reserve Bank of St. Louis puts it, “When households are younger, they tend to have lower levels of wealth.”
The picture changes when generations are compared at similar ages. At an average age of 34, millennial and Gen Z households had average inflation-adjusted wealth of $347,000, versus $257,000 for boomers at roughly the same age. That was $1.35 for every $1 held by baby boomers at the same age.
These figures are averages rather than medians, so they better reflect the experiences of wealthier households. Even so, the comparison shows why today’s total wealth gap is not a simple scorecard of which generation worked harder or handled money better.
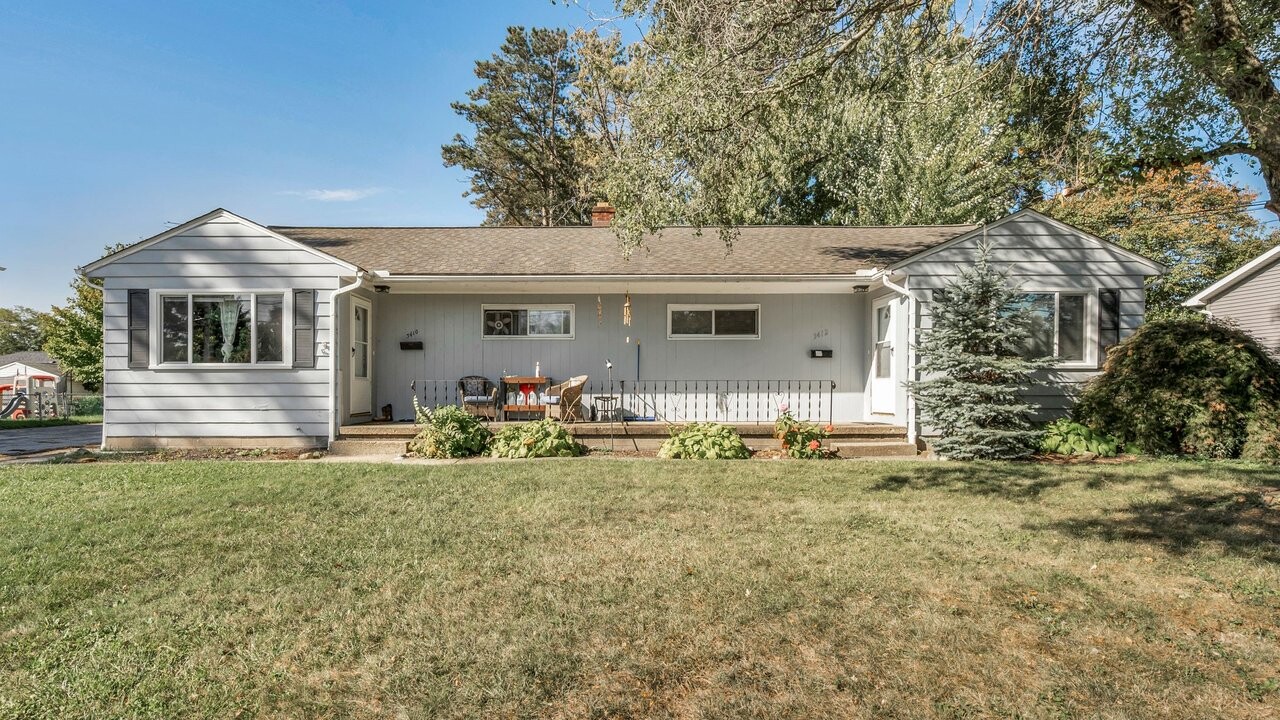
How Did Housing Help?
Housing is one of the clearest dividing lines. Census Bureau data for the third quarter of 2026 put homeownership at 79.1% among householders 65 and older, compared with 36.6% among those under 35.
Many boomers also entered the housing market when purchase prices looked very different. The median new single-family home sold for $64,600 in 1980 and $417,400 in 2025. This is not a complete affordability comparison because inflation, incomes, interest rates, and the homes themselves changed.
Buying earlier gave many homeowners more time to repay a mortgage and benefit from increases in property value. That combination can build substantial wealth over time.
The Federal Reserve’s 2025 Survey of Consumer Finances found median net worth of $458,900 for homeowners, compared with $10,600 for renters and other nonowners. The figures show a strong divide, although they do not prove that homeownership alone caused the difference.
Did Pensions and Stocks Matter?
They did for many households. Boomers began their careers during a changing retirement system. The Bureau of Labor Statistics tracked a shift from defined-benefit to defined-contribution plans during the latter part of the 20th century.
In 1989, 63% of full-time employees at private establishments with at least 100 workers participated in defined-benefit plans. These plans generally promise lifetime benefits based on earnings and years of service.
A defined-contribution plan instead provides an individual account that may receive employee and employer contributions. Its benefits are not guaranteed and can fluctuate with investment returns.
Market timing also helped households that already owned investments. Federal Reserve data show that the value of household corporate equities rose from $63.3 trillion in the first quarter of 2026 to $74 trillion in the second. The effect was uneven because equity ownership is concentrated among higher-income households.
Why Doesn’t Every Boomer Feel Wealthy?
The wealthiest households pull generational averages sharply upward. In the Federal Reserve’s 2025 survey, families headed by someone ages 65 to 74 had mean net worth of nearly $1.9 million, but median net worth was $431,300. The median is the midpoint, with half of families above it and half below.
Retirement coverage also varies widely. In a separate 2025 Federal Reserve survey, 78% of adults 65 and older reported having a tax-preferred retirement account or pension. That leaves 22% without either one.
Job history, education, health, inheritance, and homeownership can produce very different outcomes within the same generation. Aggregate figures tell us who holds assets as a group. They cannot tell us whether every older neighbor can comfortably pay for groceries, home repairs, and medical bills.
Baby boomers’ wealth reflects a mixture of age, opportunity, timing, and inequality, not a reason to blame parents or children. Which part of this financial story best matches what you have seen in your own family?
This article is for general information, not financial advice. Rules and amounts can change, so check Social Security, Medicare or the IRS, or speak to a financial adviser, about your own situation.
Follow The HyperHive on MSN for more stories like this.
Sources: